Institutional
Institutional
The image depicts a wind turbine captured from an aerial or elevated perspective, showcasing its blades catching sunlight, which is creating a bright glare in the photo. A second wind turbine can be seen in the background against a clear sky, indicating a likely setting in a wind farm or renewable energy site. The landscape below appears to be a mix of fields and forests.
ESGlocate - the First Analysis and Allocation Tool for Sustainable Bonds

Allocate Your ESG Bonds Efficiently and Transparently

New issues of “Green” or “Social” Bonds are often heavily oversubscribed. DZ BANK's digital tool, ESGLocate, helps issuers to analyse their order-book and identify sustainable investors. The underlying data is based on investors’ answers to a questionnaire about their investment behaviour and the ESG strategies they use.

Progress through Digital Processes

ESGlocate offers issuers a tool which is...

Tailor-Made ESG Allocation For You

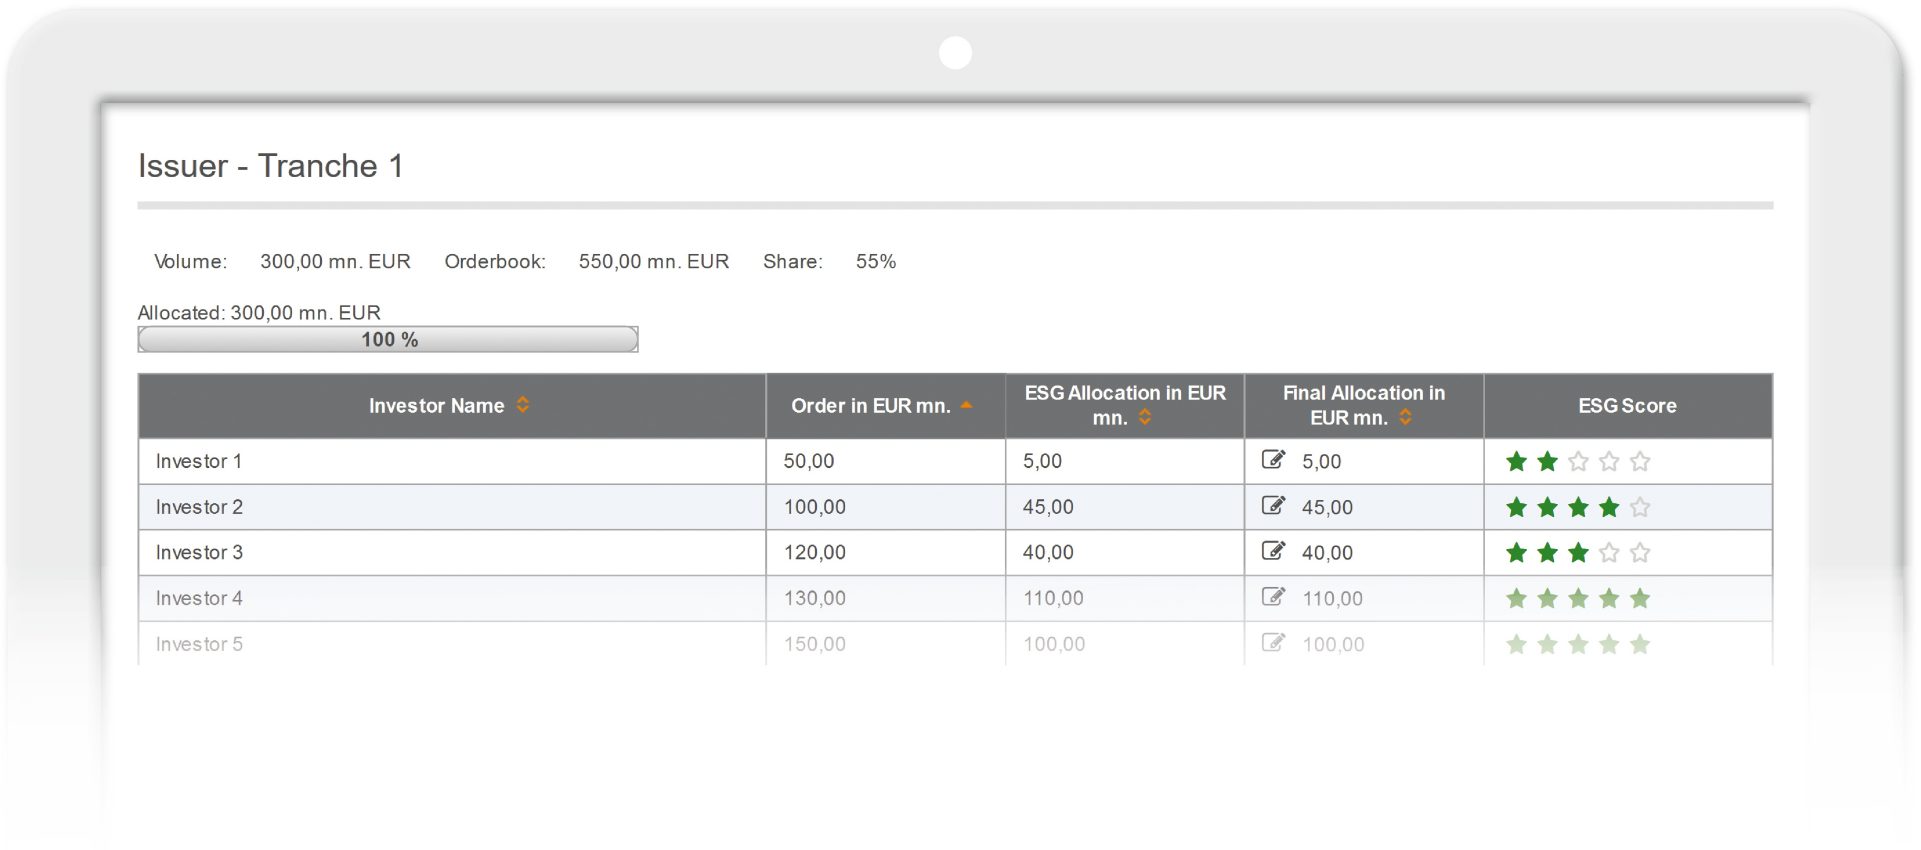
Each time they use ESGlocate, issuers can give greater weight to the indicators that are important to them, and receive a proposal as to what volume should be allocated to individual investors in the order book of their bond. Thus, issuers can identify suitable investors more precisely by using their pre-defined sustainability criteria, and create transparency and traceability by using ESGlocate.

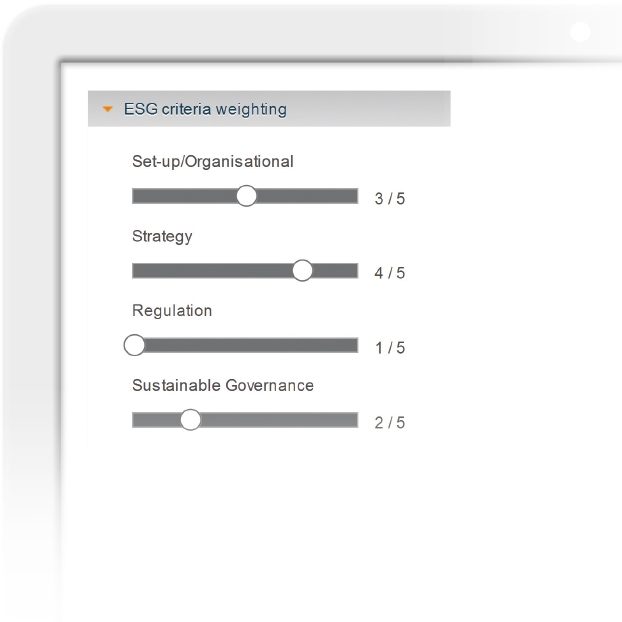
Allocate Your ESG Bond Using Four Broad Criteria:


- Set-up / organisational

- Strategy

- Regulation

- Sustainable Governance

The image appears to display a digital interface or application that features a set of sliders related to weighting different criteria of ESG (Environmental, Social, and Governance). The specific categories evaluated by the sliders include:

1. **Set-Up/Organisational:** 
   - A slider with a value of 3 out of 5.

2. **Strategy:**
   - A slider with a value of 4 out of 5.

3. **Regulation:**
   - A slider with a value of 1 out of 5.

4. **Sustainable Governance:**
   - A slider with a value of 2 out of 5.

Each category has a numbered scale from 0 to 5 (where 5 might suggest a high level, and 1 suggests a lower level of importance or adequacy). The sliders adjust the weighting or importance of these categories in ESG criteria evaluation. The interface is likely part of a larger program or decision-making tool aimed at assessing organizational performance or compliance in terms of ESG standards. 

Overall, the image reflects a focus on assessing the balance between different facets related to organizational setup, strategic planning, regulatory adherence, and sustainability governance within an ESG framework.

Transparent and Efficient Analysis and Allocation of Your ESG Bond Order-book ...


The image appears to display a digital interface or dashboard on a tablet screen. 

### Key Elements of the Image:

1. **Header & Logo**:
   - At the top left of the interface, there is a logo with "ING BANK" followed by "ESGlocate." This suggests a platform related to ING Bank, possibly focusing on ESG (Environmental, Social, and Governance) investment or management.

2. **Navigation Panel**:
   - On the left side, there seems to be a vertical navigation menu featuring options like "USER DASHBOARD," "ADMINISTRATION," "COMPANY SEARCH," among others. This provides different functionalities or sections within the platform.

3. **Main Content Area**:
   - The central part of the interface showcases a table titled "Account - Transaction 1," presenting data organized in rows and columns.
   - Columns labeled "Description", "Type", "Date", "Amount", "Status" and containing numerical data.
   - There are green stars present under the "Status" column, which might represent ratings or success indicators.

4. **Secondary Options**:
   - Beneath the table are different tabs labeled "Detail," "Related," "Documents," and "History," likely for drilling deeper into specific sections or types of information.

5. **Footer & Supplementary Details**:
   - The bottom section features small text, possibly providing copyright details or information about the dashboard version, indicating that information about "Terms & Conditions" and "Privacy Policy" can be found there.

### Overall Description:
- This image showcases an enterprise or professional software interface, targeted for use by financial professionals or administrators dealing with ESG-related data, transactions, or assessments. It aims to offer tools or insights into various transactions and account details linked to governance and sustainable practices.

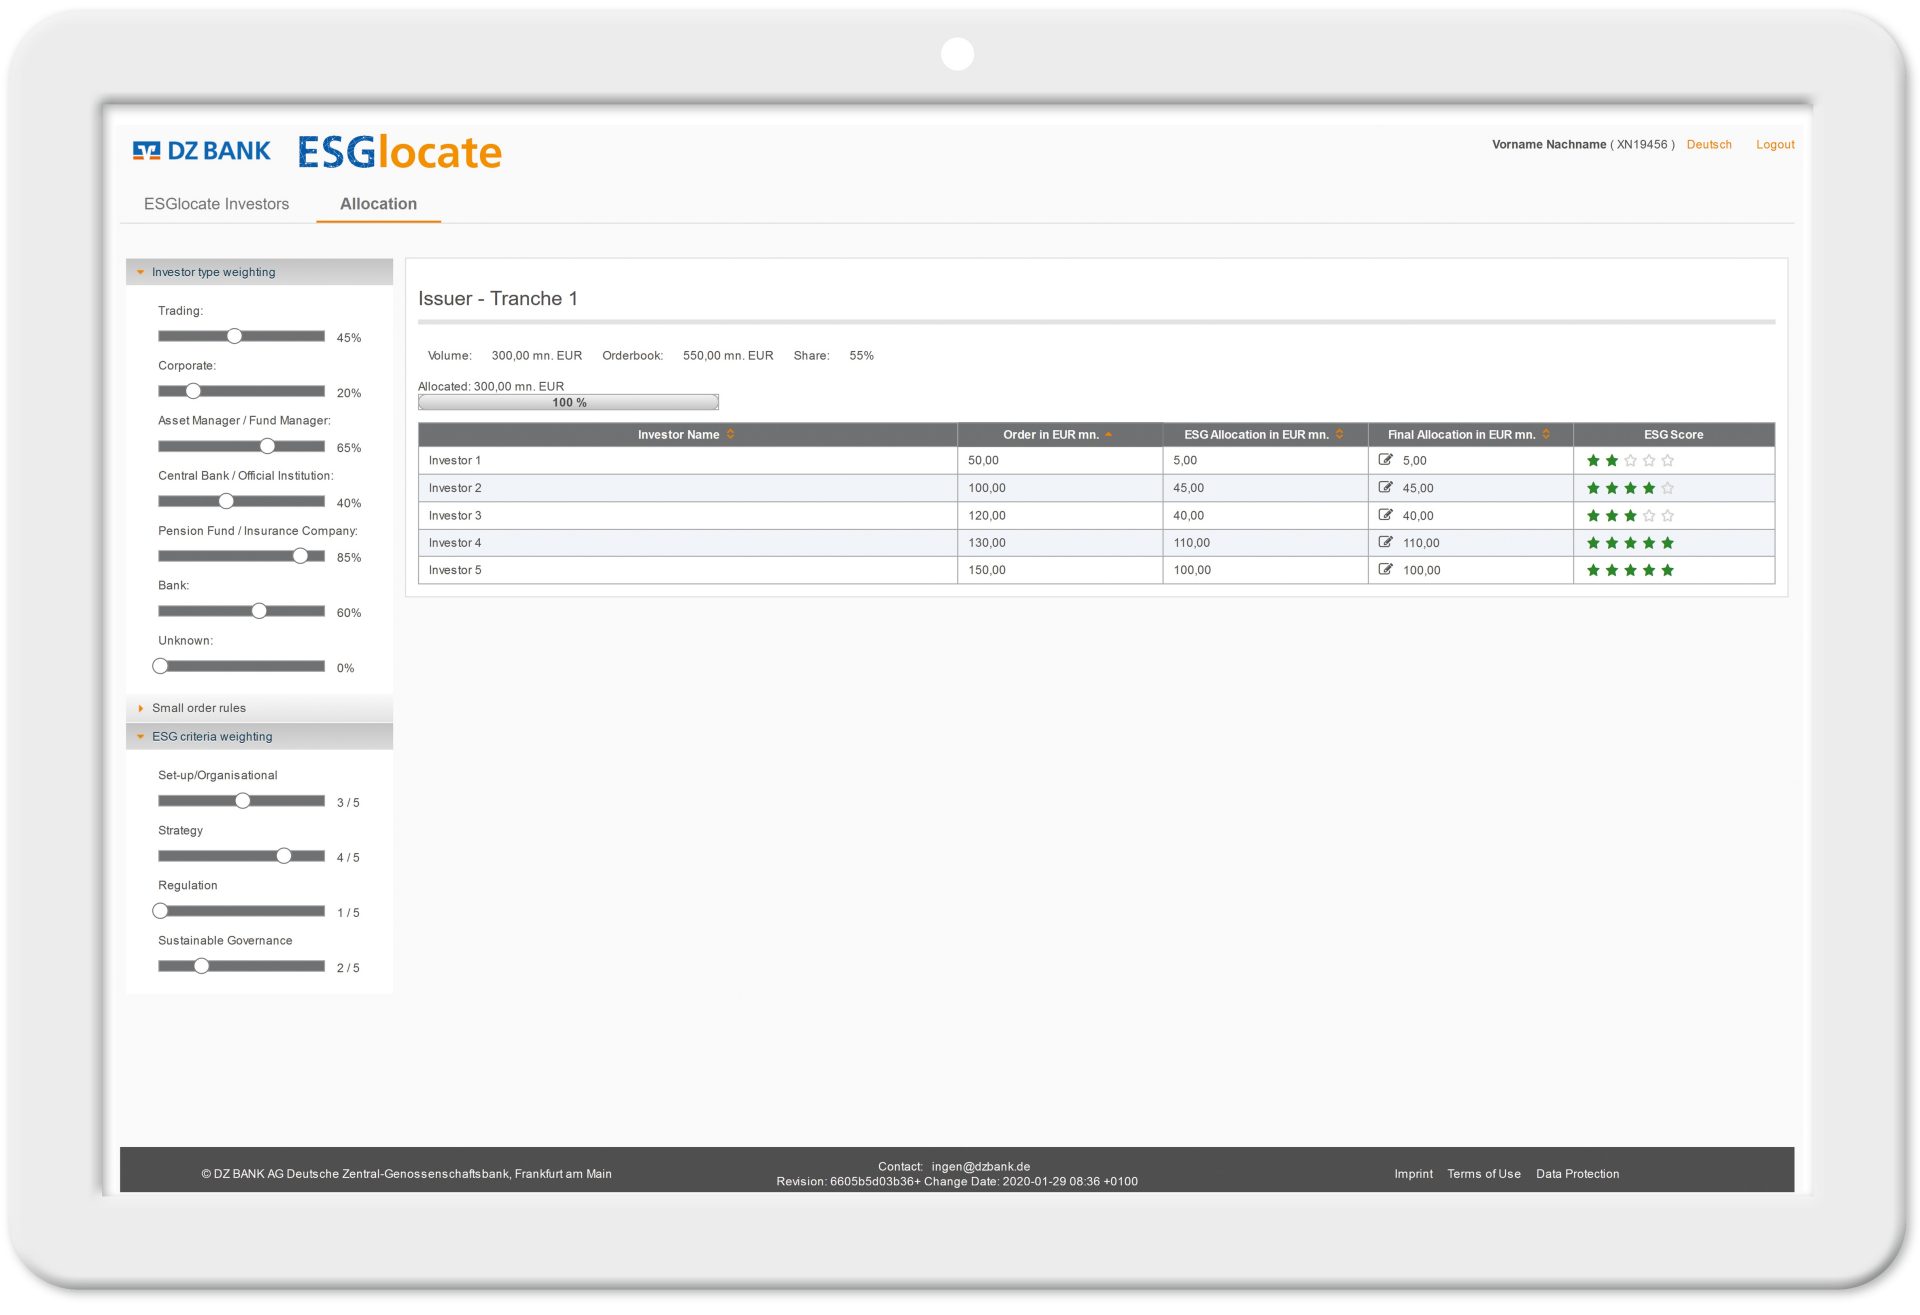
... by assigning an ESG Score (based on your ESG criteria weightings)


The image appears to display a digital interface, likely a financial dashboard or management system. Here's a detailed breakdown of what might be visible in the image:

1. **Header**:
   - **Title**: "Issuer - Tranche 1" suggests this interface pertains to a financial transaction or asset management system dealing with tranches, which are portions of securities or bonded debt.
   - **Metrics Display**: Includes numerical data such as "Volume: 150,000 mm USD", "Distribution", "1,500 mm USD". These may represent financial figures or transactions within tranche 1.
   - **Status Date**: The header also displays a "Status Date", likely providing the date reflecting the current data or financial status.

2. **Content Table**:
   - **Headers**: 
     * "Tranche Name"
     * "Date" 
     * "Expected IRR %"
     * "Strategy Outcome in mm USD"
     * "Risk Adjusted Outcome in mm USD"
     * "Outcome %"
 
   This suggests varying financial strategies and outcomes related to different tranches or investment portions.

3. **Rows**:
   - Shows different entries likely corresponding to different tranches or investment strategies (e.g., "Issuance 1", "Issuance 2", "Issuance 3")
   - **Data Points** for each entry, including:
     * Financial amounts and outcomes
     * Percentage values possibly indicating rate of returns or financial health
 
4. **Visualization elements**: 
   - Star ratings next to "Outcome %" indicating evaluation or risk tiers, which are typical in investment assessments.

The interface is likely used by financial analysts, asset managers, or any stakeholder attempting to manage, assess, or report on tranche-based investments. The data helps in decision-making and strategic planning by detailing outcomes and risk implications. 

This image represents a snapshot of financial information focusing on tranche management with detailed metrics for tracking and planning purposes.
The image contains a logo with the text "ESGlocate" prominently in the center. Beneath it, in smaller letters, are the words "Informed Allocation." The color scheme uses a bold blue for "ESG" and a bright orange for "locate," suggesting a connection to themes related to environmental, social, and governance (ESG) criteria. The overall design appears focused on clarity and professional branding, likely representing a company or service related to ESG data or analysis.